Search The Knowledge Base
Campaign Reports With Looker Studio
Using a Looker Studio (Google Data Studio) application, to generate custom interactive visualization reports for GS1 Digital Link, and QR code or NFC marketing campaigns, from the respective campaign table, go to Options > Looker Studio Reports.
On the new page, choose a campaign group or a specific campaign, and a period the reports will frequently be generated in.
Click on the Generate Report button.
In the pop-up that then appears, click on the Copy Looker Studio URL.
Note – the copied URL should not be shared publicly.
Importing campaign reports data in Looker Studio
Open a new Google Sheets spreadsheet, then give it a name.
After that, select cell A1 then go to the fx section, then paste the URL string that you copied then press ENTER on your keyboard.
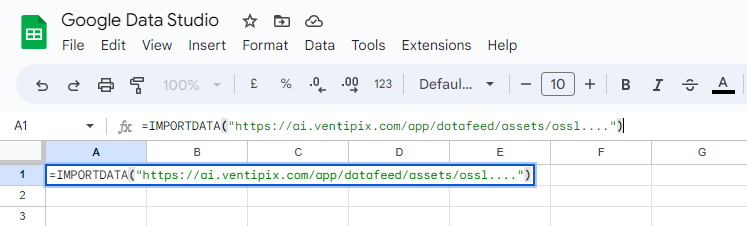
After a few seconds, your data will be shown on the spreadsheet.
Once that’s done, log in to your Looker Studio account.
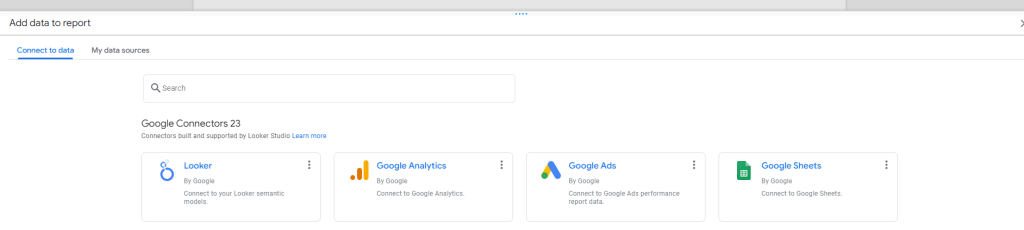
Click on the Blank Report template.
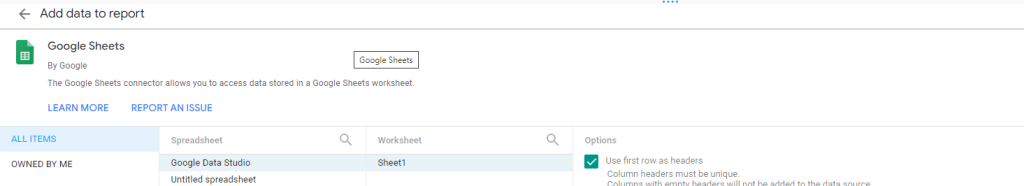
From the “Add data to report” prompt, select Google Sheets. Follow authentication steps if prompted for them.
You will then be presented with a list of spreadsheets.
Select the one that you imported the data to.
Once Looker Studio has imported your data, you can then generate the reports that you want.
The URL that you copied will always generate current data based on the period that you defined.
Google Sheets will continue refreshing the data on its own.